Measure and optimize Cumulative Layout Shift (CLS)

What is Cumulative Layout Shift (CLS)?

A low Cumulative Layout Shift (CLS) is crucial for a positive user experience. The CLS key figure refers to unexpected layout changes on a website during the loading process and when using the site. Layout changes can lead to the user losing orientation on the page or unintentionally clicking on links. Suitable optimization methods can minimize page jitter during loading and improve the user experience.

The evaluation of layout changes is recorded by the CLS metric, which is part of Google’s Core Web Vitals and is displayed in the Google Page Speed report and in the Google Search Console. The CLS, together with the other two metrics FCP and LCP, influences the overall Google Page Speed Score.

How is CLS measured?

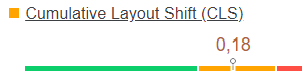
To measure and optimize the Cumulative Layout Shift (CLS), it is important to know that a lower value is better, as it indicates fewer layout shifts. The aim is to achieve a maximum value of 0.1 for at least 75% of page views. If the value is between 0.1 and 0.25, some improvements are required. Suitable tools can be used to determine the CLS value and carry out targeted optimization measures. While the other Core Web Vitals are measured in seconds or milliseconds, there is no unit for the CLS. It measures how much content is shifted and how strong this effect is. The values for layout shifts that do not occur within 500 milliseconds of user input are totaled.

Google Page Speed Insights classifies values above 0.25 as poor and displays them in red. However, this does not necessarily mean that there are numerous display problems. It could just be a single problem with a big impact.

What is not included in the Cumulative Layout Shift?

Expected shifts
Many shifts after loading a page may be the result of a user interaction and are therefore excluded from the CLS score as they are expected shifts if they occur within 500 milliseconds of this action. These can be click or touch inputs, for example.

Unexpected shifts
However, other shifts unexpected by the user after the initial loading process can be taken into account in the CLS value, e.g. when scrolling down the page and content is slow to load and this leads to shifts in the layout. Another common cause of CLS after loading is moving content when hovering.

Which tools can be used to measure CLS?

Google Page Speed Insights is the preferred tool for measuring and optimizing CLS. It provides a detailed analysis for each URL. This method is known as measuring laboratory data and helps to diagnose performance problems. The CLS value can be optimized by stabilizing elements, preloading fonts and prioritizing the loading of content. Field data (CrUX) can also be used, provided there is sufficient user data from website visitors. This data provides information about the UX from the user’s perspective.

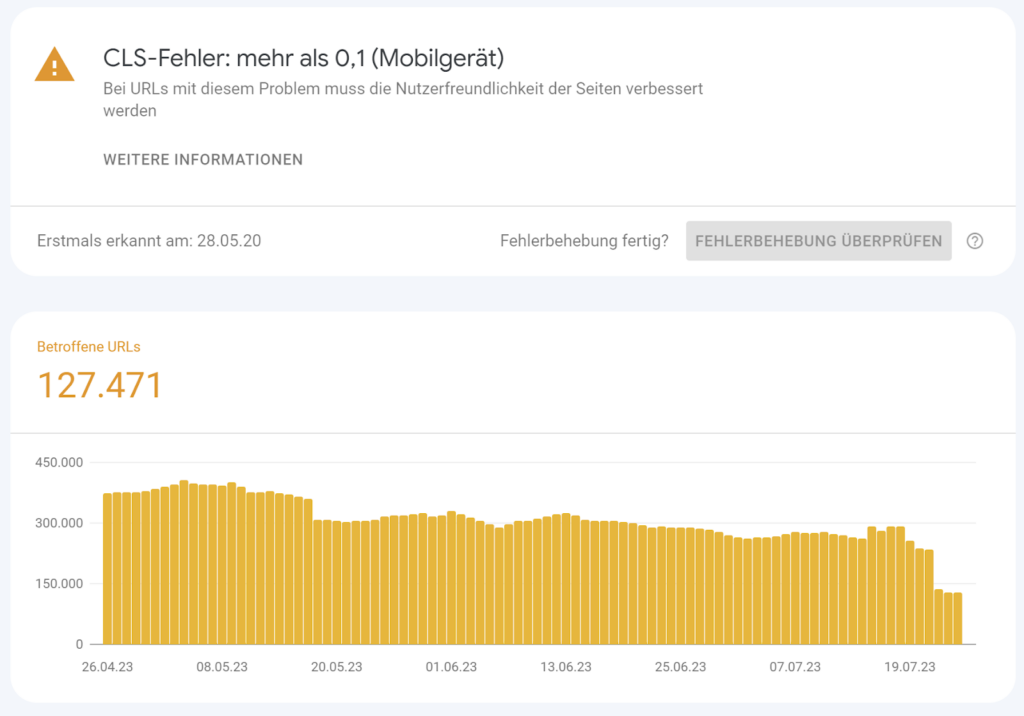
If field data is already available, a report for the individual URLs is also available in the Google Search Console to help you identify the errors. However, it should be noted that it can take up to 30 days for Google to check corrections. For accurate measurement, it is also important that the site is visited by a sufficient number of users.

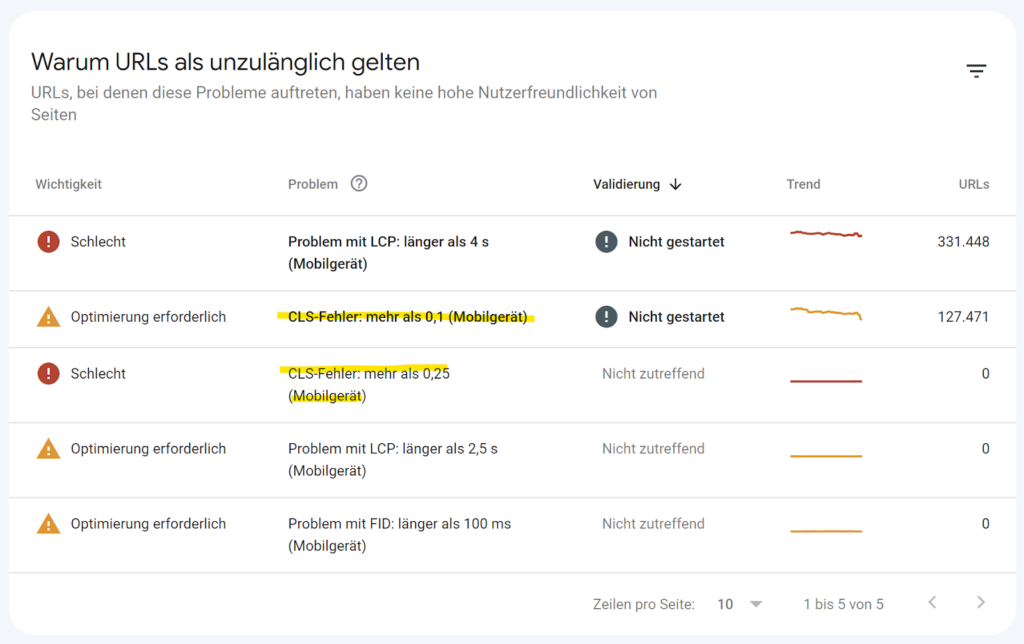
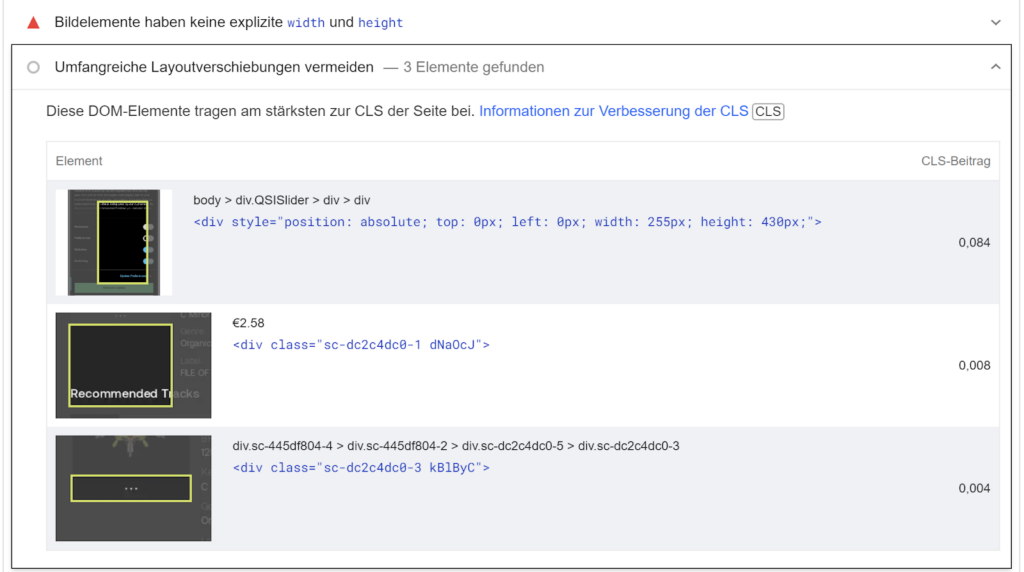
Below this display you will find URL groups that have similar problems. I first sort here in descending order according to the highest group CLS and then select the group with the worst value first. A window will then open on the right-hand side with the individual URLs from the group and their measurement results. To get a more detailed insight into the problems, you need to analyze individual URLs with the Google Page Speed Insights tool. You can then filter down to the CLS problems below the screenshots.


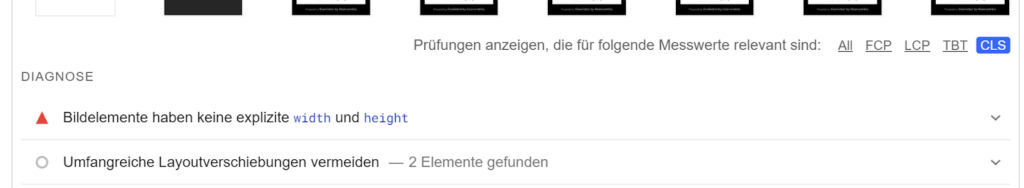
Only the errors that are directly related to the CLS value are highlighted in the diagnostics. These errors must then be specifically optimized in order to improve the CLS value.


The tool webpagetest.org offers a good visualization in single images, so that you can see the page structure very well. This also makes it easy to display layout shifts during page construction.

By installing the browser extension for Google Chrome you always have the Core Web Vital KPI in view, even while surfing.

If you want to check the Core Web Vital values for many URLs and a Google Search Console account may not be available, then there is also the option of retrieving these via the Google Page Speed API.

Monitoring of Cumulative Layout Shift

A look at the Google Search Console at least once a week provides information about the CLS problems of a website.

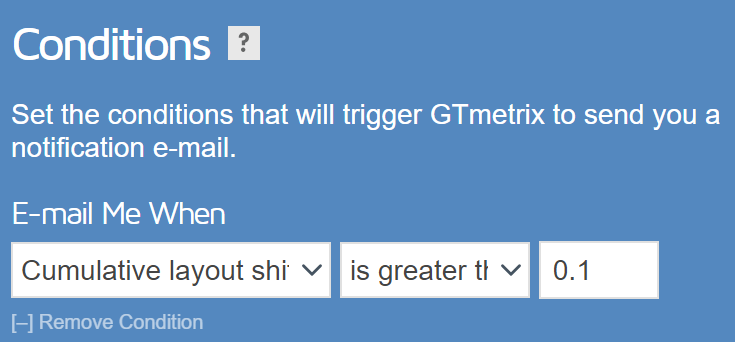
Alternatively, you can also set up regular monitoring in tools such as gtmetrix.com. This allows you to react earlier before the problems appear in Google Search Console.

In addition to the routine reports, you can also set up alerts that inform you when certain limit values are exceeded:

Checklist for optimizing CLS

The reports in the Google Search Console and Google Page Speed Insights already provide good instructions on the necessary optimizations. In general, you should take the following points into account to prevent your CLS score from deteriorating in the first place:

  • Add size specifications for images in the source code (width and height in the image tag)

  • Avoid CSS animations or non-composite animations or use alternative CSS techniques that do not trigger the redrawing of a layout.
    • The CSS properties “Box-Shadow” and “Box-Sizing” should not be animated.
    • For example, animations with the CSS property “Transform” can be used to move, scale, rotate or skew without triggering a new layout, thus completely avoiding layout shifts.
    • Composite animations via the CSS property “Translate” are excluded from CLS, as they cannot affect other elements.

  • Provide placeholders for content, for example with the CSS “min-height” specification, which are loaded and displayed later. For example, advertising banners with dynamic display sizes or YouTube videos that are integrated via embed tags, Google Maps maps, social media walls and like boxes or other external content in iframes with dynamic sizes. You may have to use CSS Media Queries to define slight differences in the heights for the placeholders.

  • The cookie bar can also be the trigger for a bad CLS value, especially if you use external services where resources are retrieved from external servers.

  • Content elements with dynamic sizes that cause the layout to shift cause the most damage at the top of the page because they have more content below them than if they were positioned further down. Therefore, content that causes CLS should not be placed high up. But in principle, content without fixed sizes also causes CLS at the bottom of the page, just not as strongly.

  • Content to be loaded later can be inserted by the user where it makes sense; this is known, for example, from pagination buttons with an inscription such as “load more products/posts”. In such cases, it is also recommended that the content to be reloaded is loaded in the background in advance so that there is as little delay as possible for the user after clicking on such a button.

  • Web fonts can also be a cause of a poor CLS value: Often special fonts are loaded for websites (not standard system fonts), until this font is loaded, the text is displayed in the system fallback font. This ensures that the text area and the surrounding elements vary in size during the loading process. There are several ways to reduce the negative influence of the font on the CLS score:
    • Use of the CSS property “font-display:optional” – The font is only used if it is quickly available. The browser can therefore decide for itself whether the Internet connection is fast enough and whether the font can be used. This option is certainly not the best solution in most cases.
    • Always specify a replacement font in the CSS code that is as close as possible to the font to be loaded. If no fallback font has been specified in the CSS, the default system font is used, but this can differ greatly from the font to be loaded, which can lead to even greater layout shifts.
    • Use of <link rel=”preload”> for faster display of custom fonts on the page.
    • Use of the CSS property “font-display:swap” for faster font rendering.

  • Use of a back/forward cache (bfcache):
    • The bfcache saves the pages for a short time in the browser’s memory when you leave the page so that they are restored exactly as you left them when you call them up again. This means that the fully loaded page is available immediately – without any delays, which can normally occur during the loading process for one of the reasons mentioned above.
    • This means that layout shifts may still occur when the page is first loaded, but when a user revisits the pages, they will not see the same layout shifts repeatedly.
    • Back and forward navigation is common on many websites. For example, returning to a content page, a category page or to search results.
    • The bfcache is used by all browsers by default, but some websites are not suitable for the bfcache for various reasons. This therefore needs to be checked.
Picture of Christian Schreiber
Christian Schreiber
I have been working as an SEO consultant with a technical focus since 2009. As a qualified business IT specialist and web developer, I support marketing specialists and programmers from start-ups, medium-sized companies, corporations and agencies in the implementation of load time optimisation for high-performance websites.

Performance improvement for cookie hints

Unfortunately, the mandatory cookie notices often have a negative impact on website performance and user experience. This is particularly evident in the Google PageSpeed analysis.